
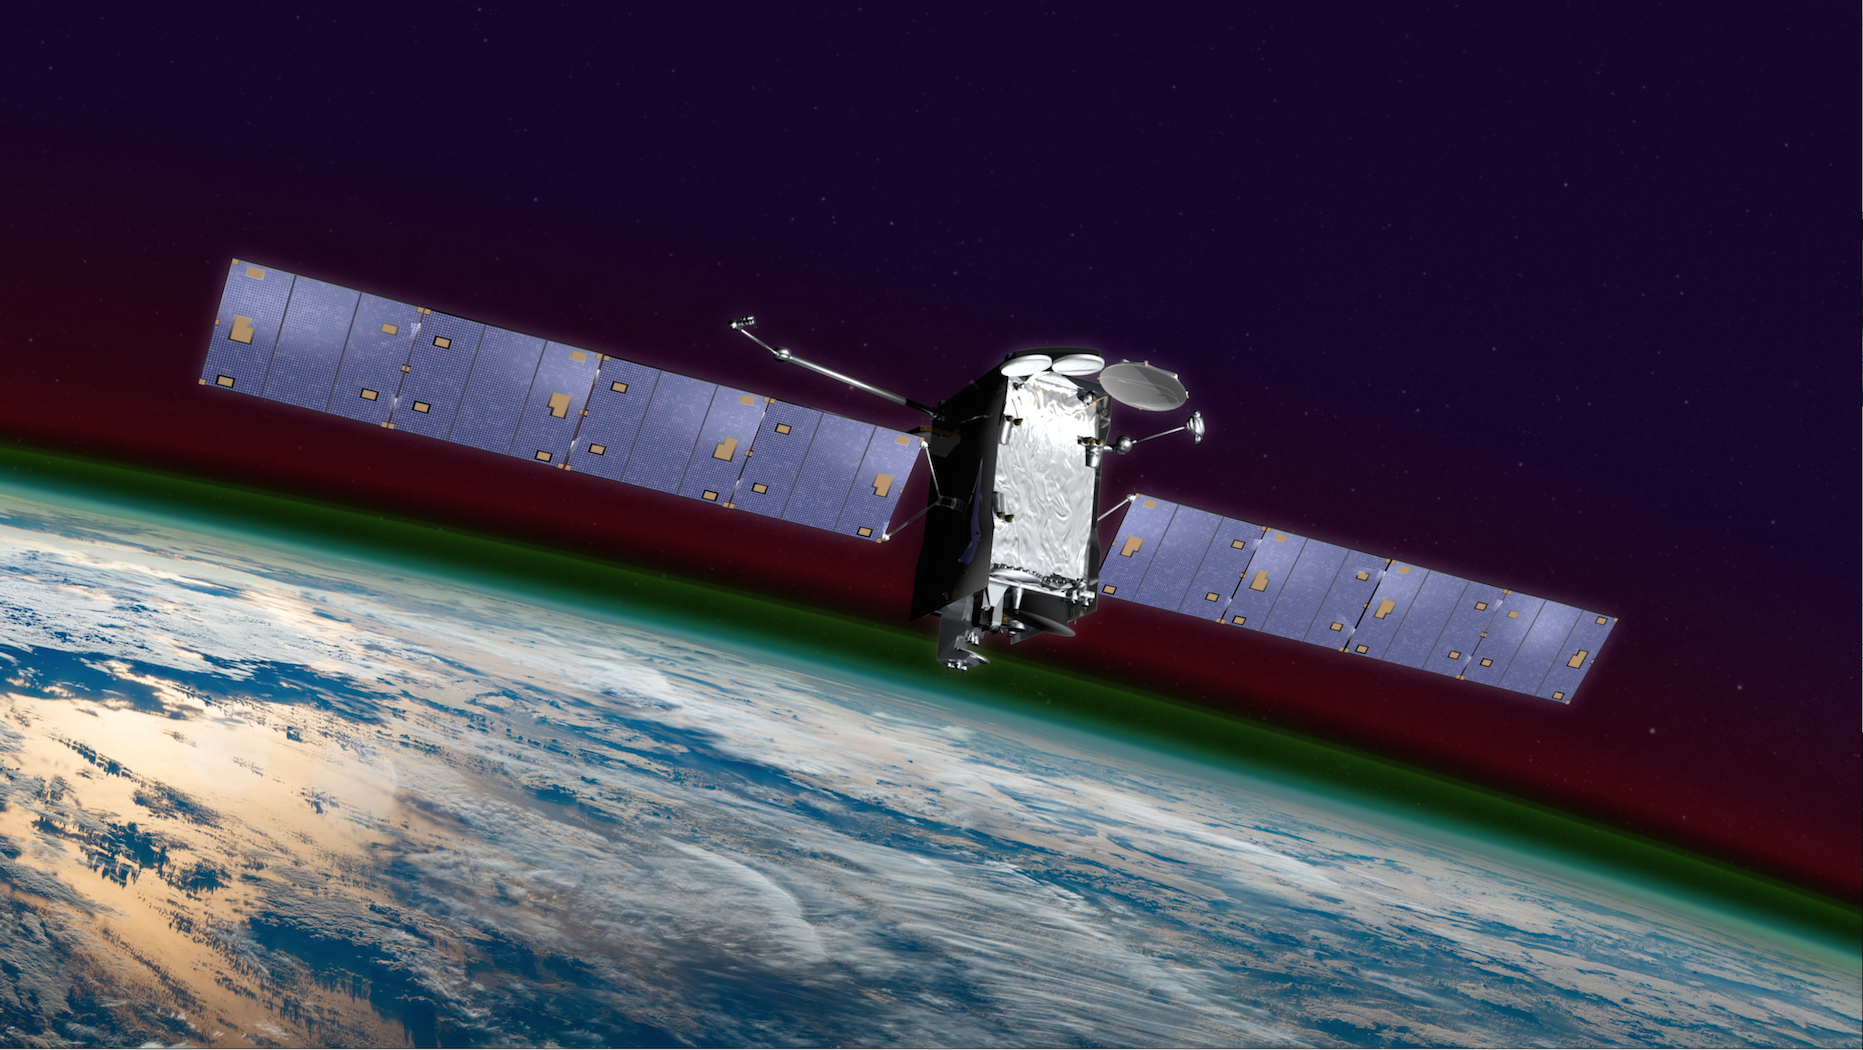
Bands of colorful airglow are visible above the limb of the Earth in this artist’s depiction of GOLD on the SES-14 satellite. (Courtesy NASA GSFC)
Print Products
Images
Please click on the thumbnail images to view the full-sized photographs.
Instrument development
 (Courtesy LASP/GOLD)  (Courtesy LASP/GOLD) 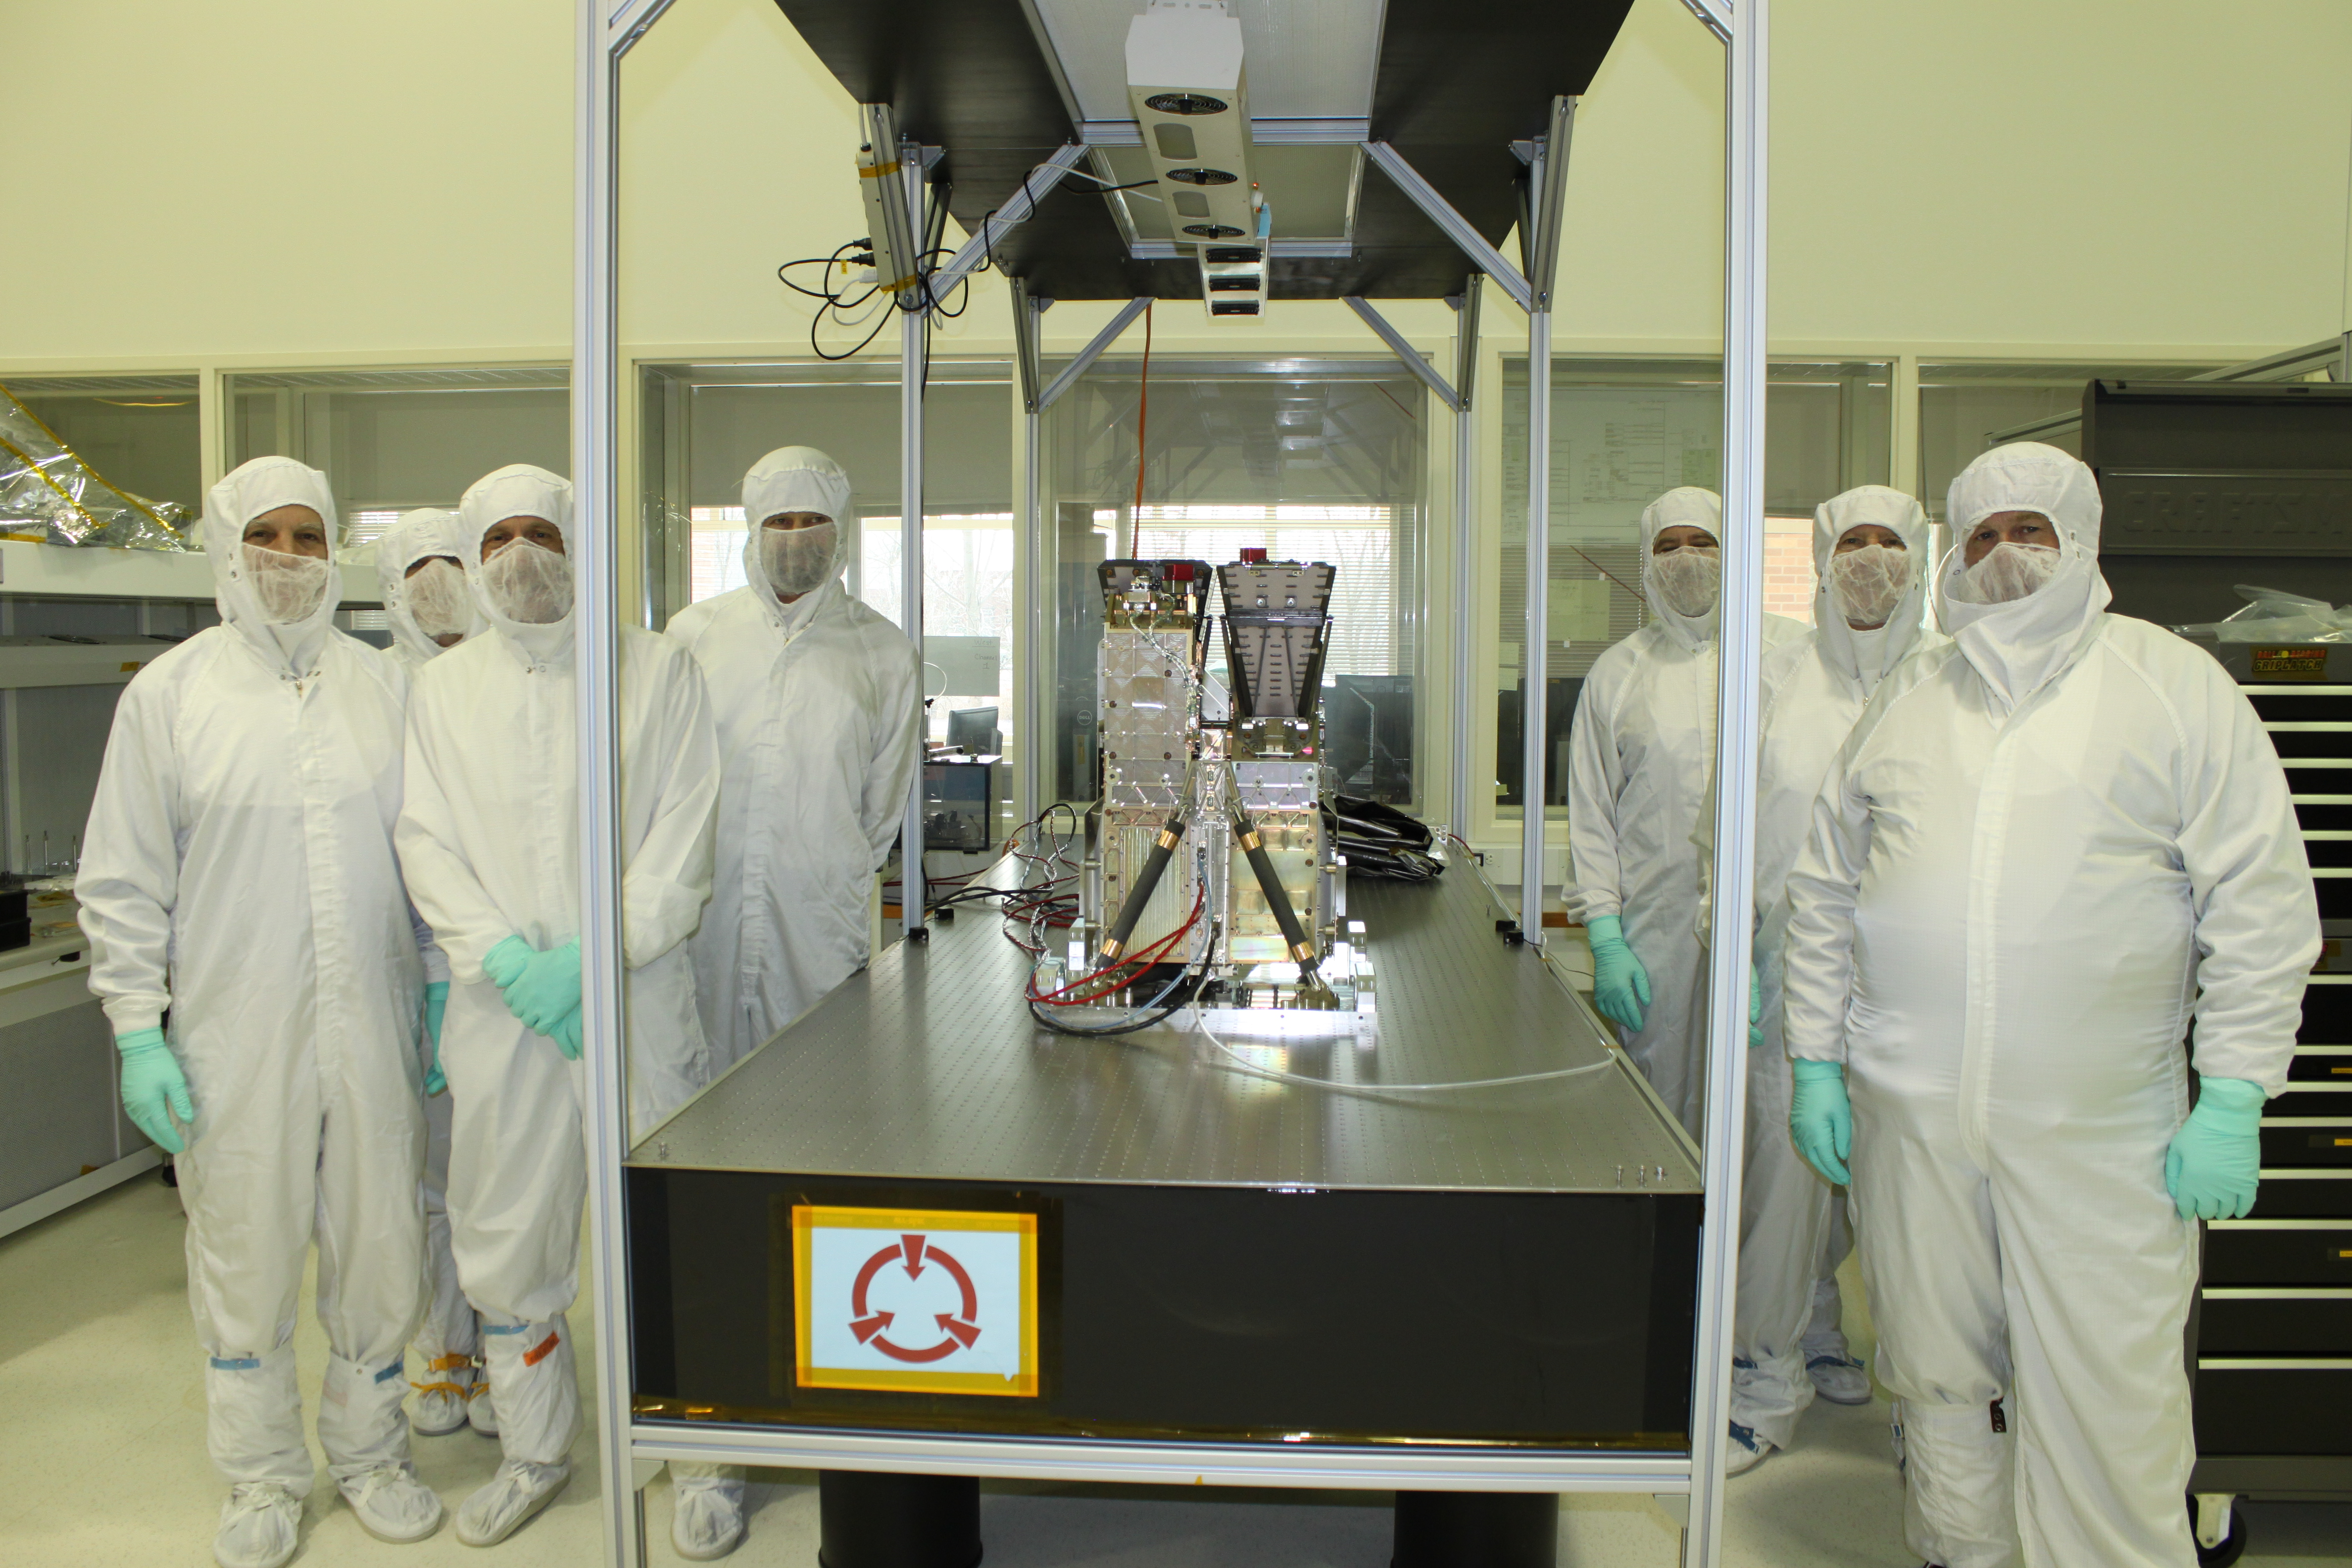 (Courtesy LASP/GOLD) 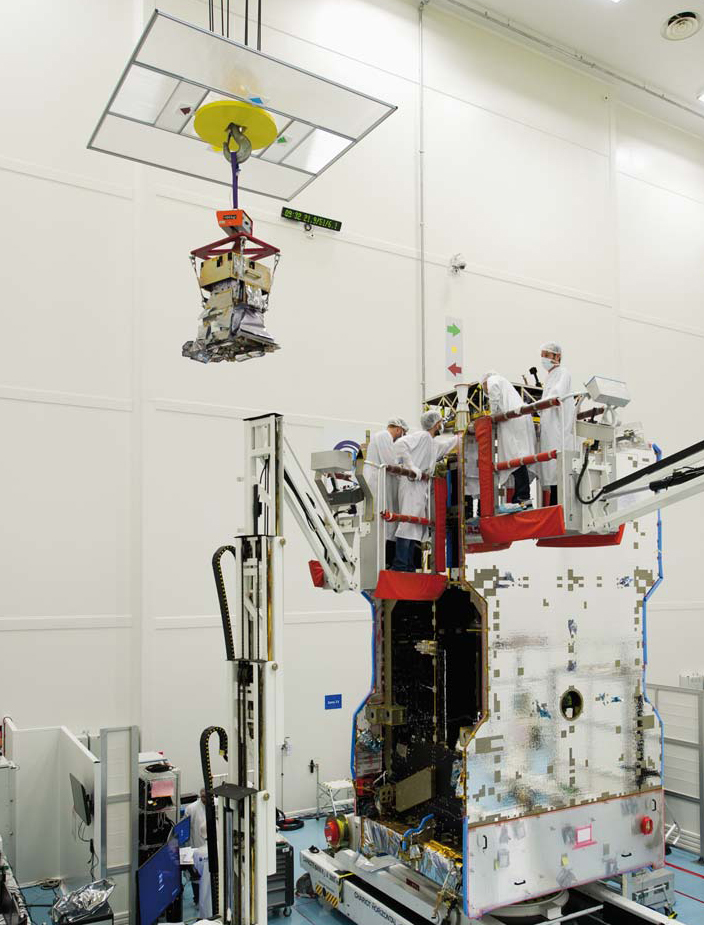 (Courtesy Airbus DS) 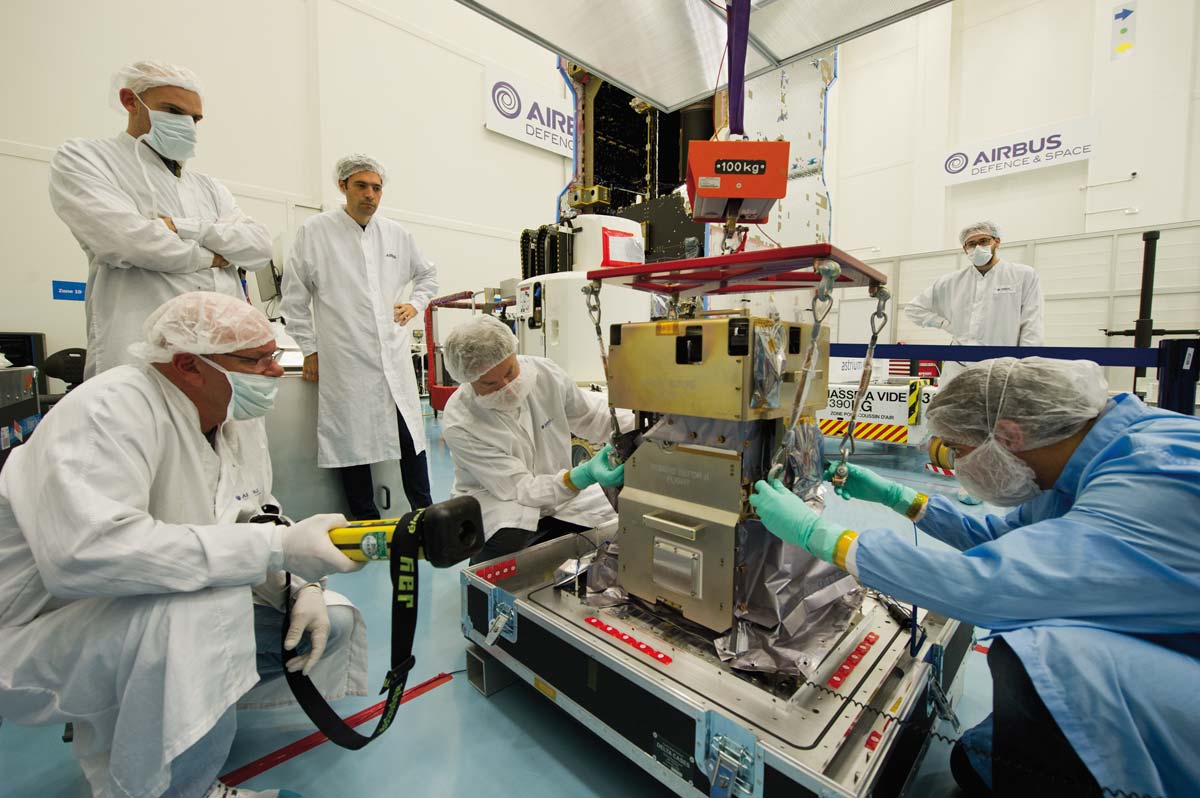 (Courtesy Airbus DS) 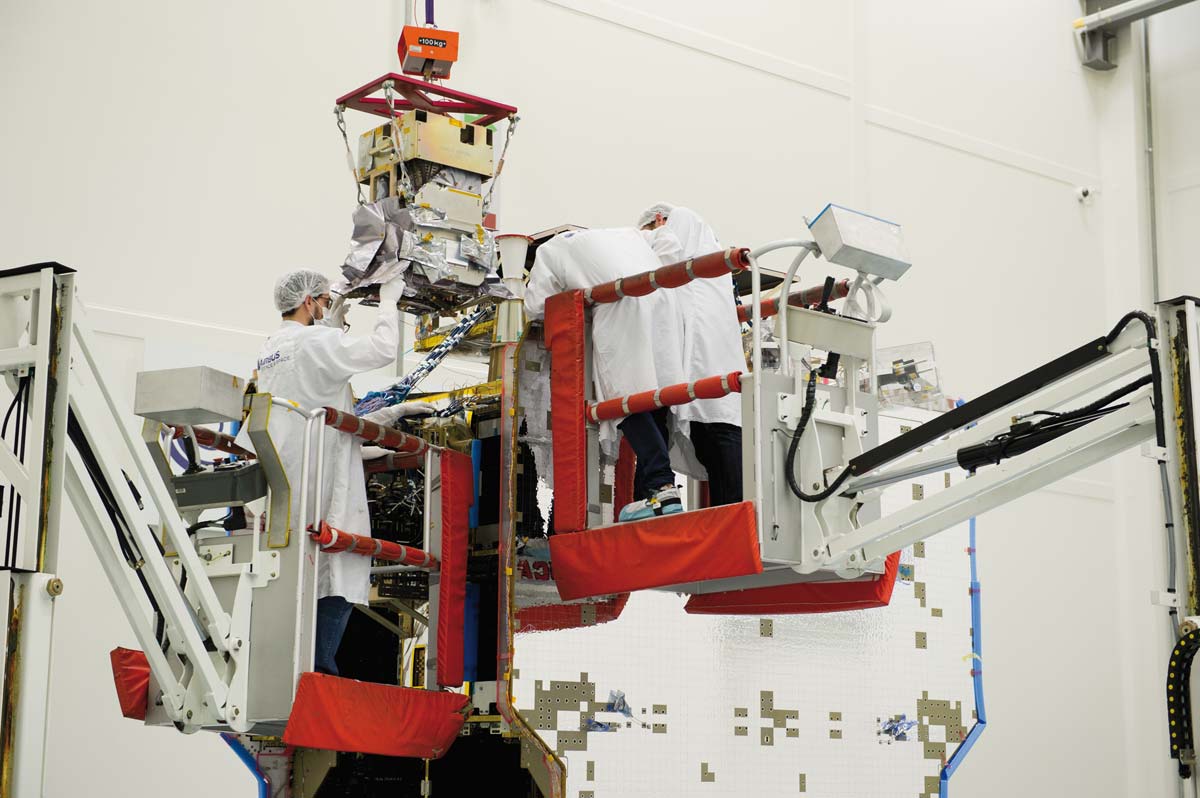 (Courtesy Airbus DS)  (Courtesy Airbus) 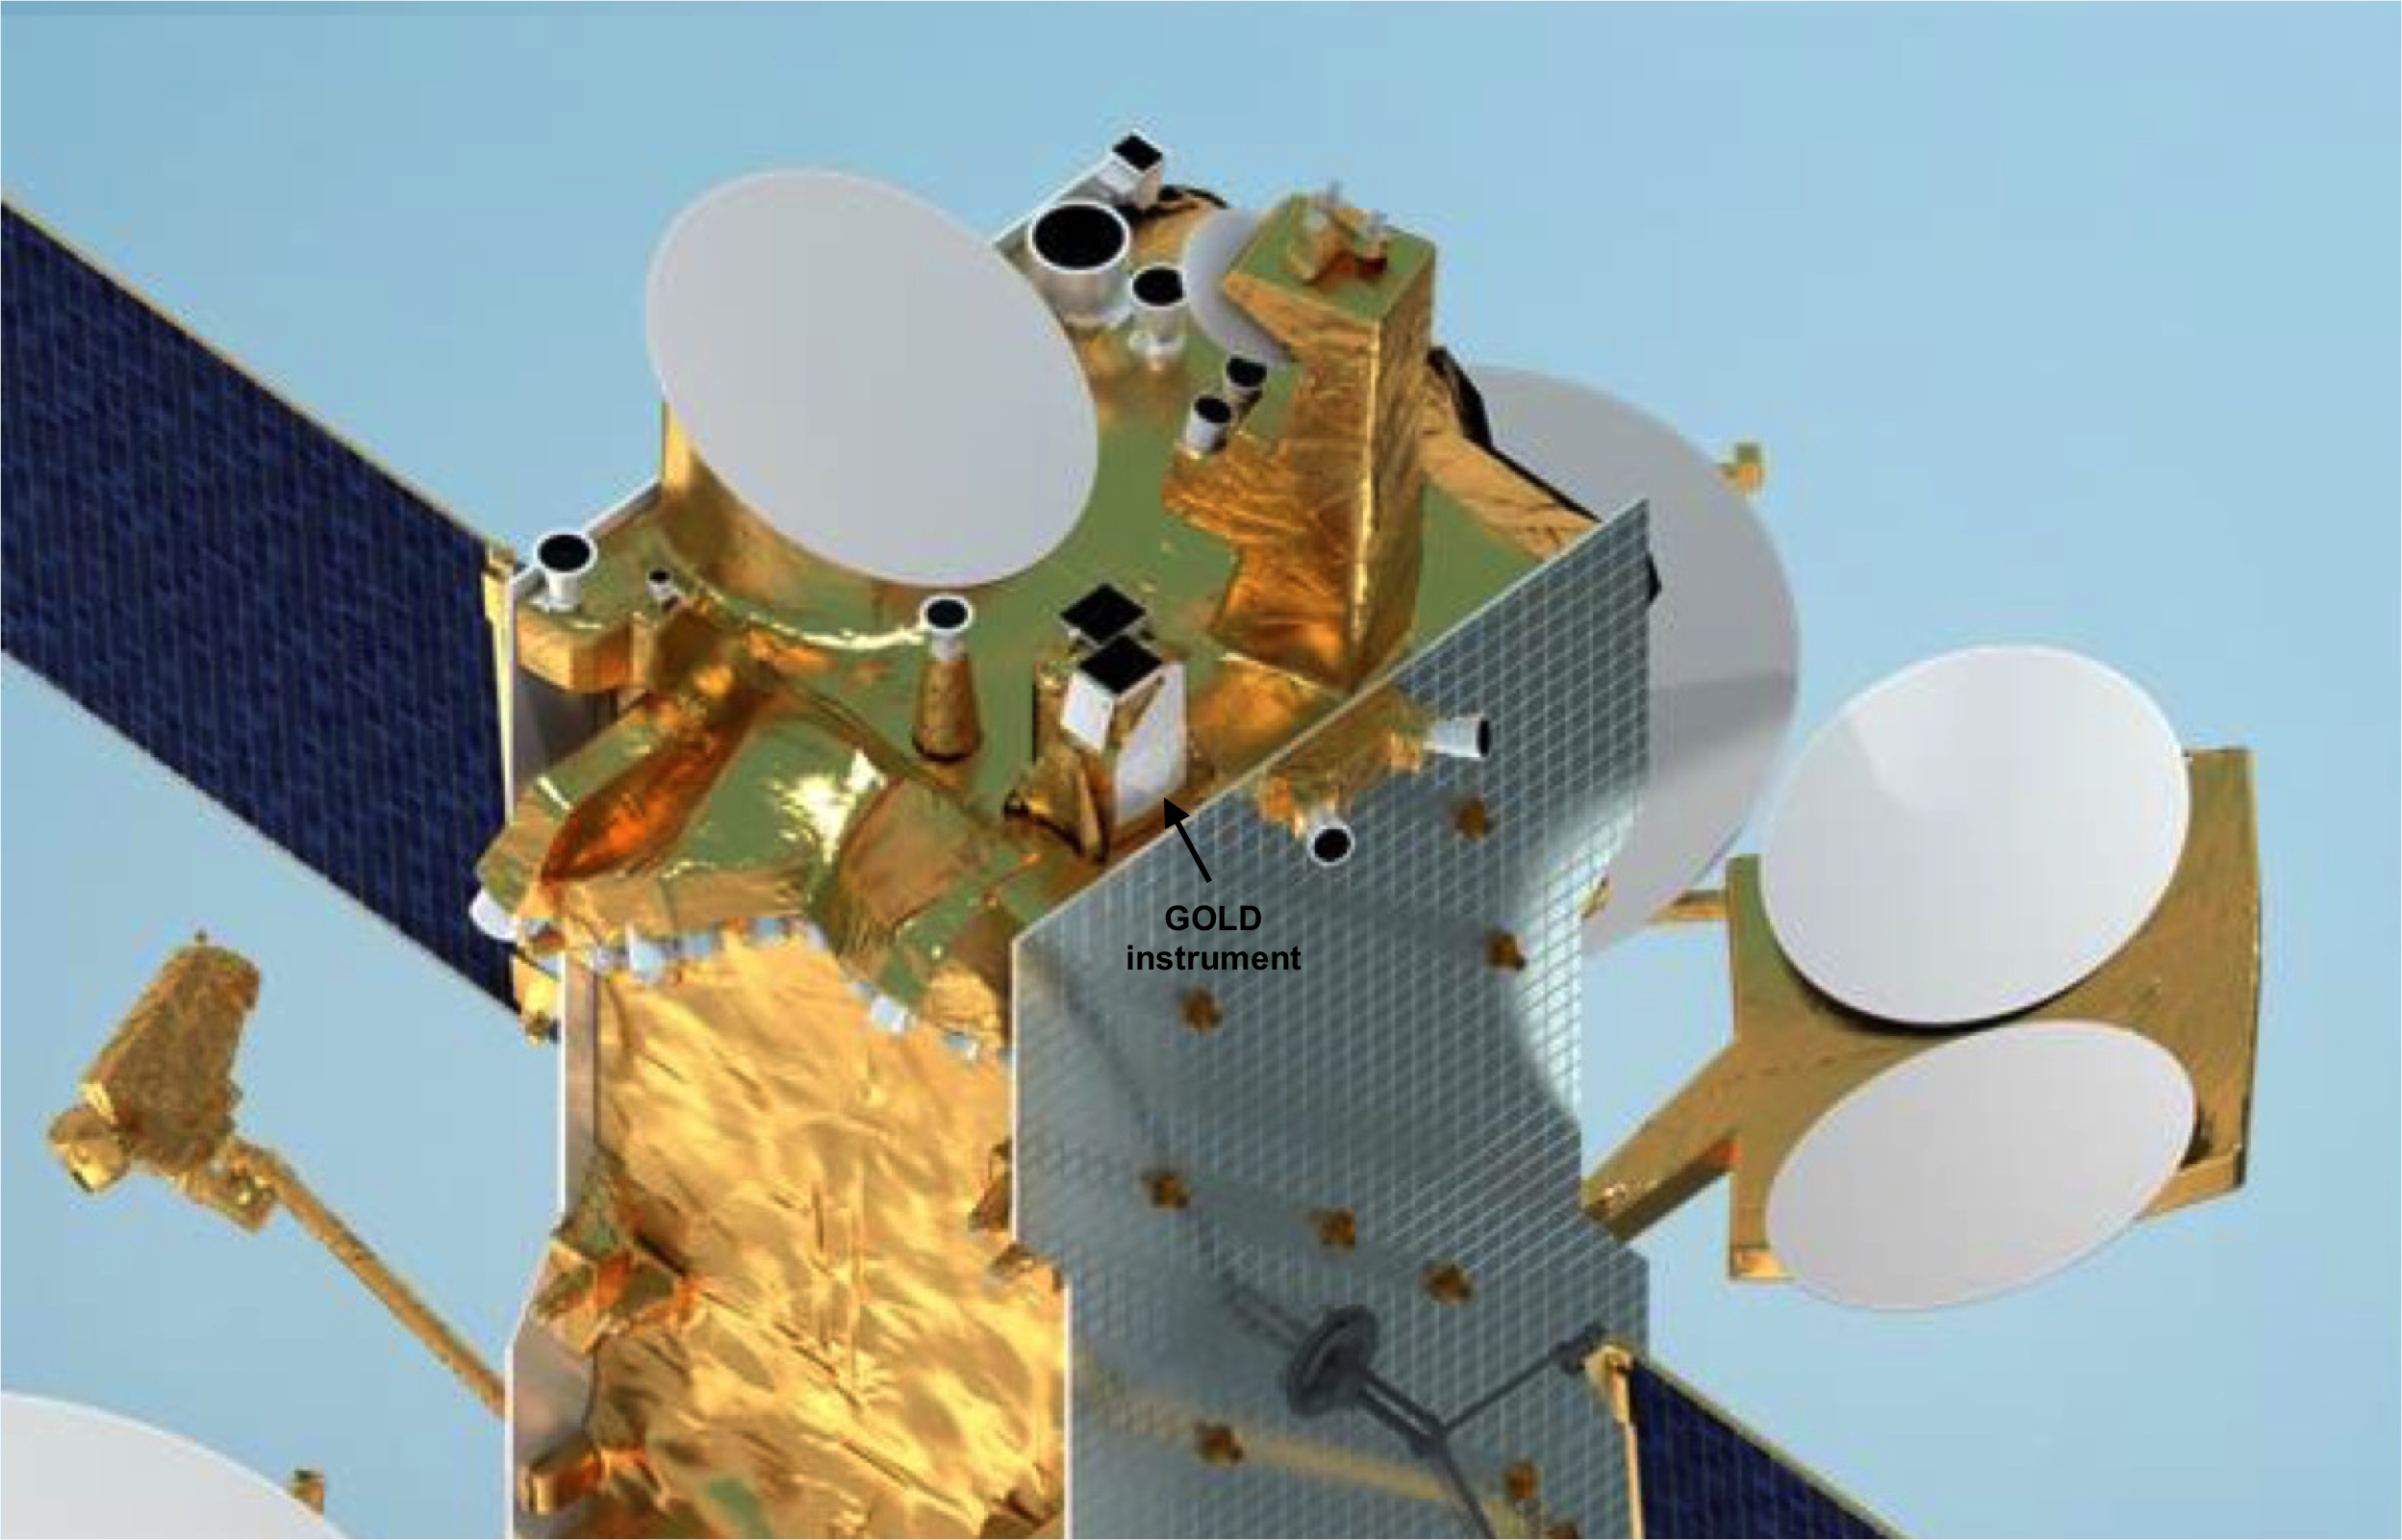 (Courtesy SES) |
Launch
|
(Courtesy ESA/CNES/Arianespace)  (Courtesy ESA/CNES/Arianespace) 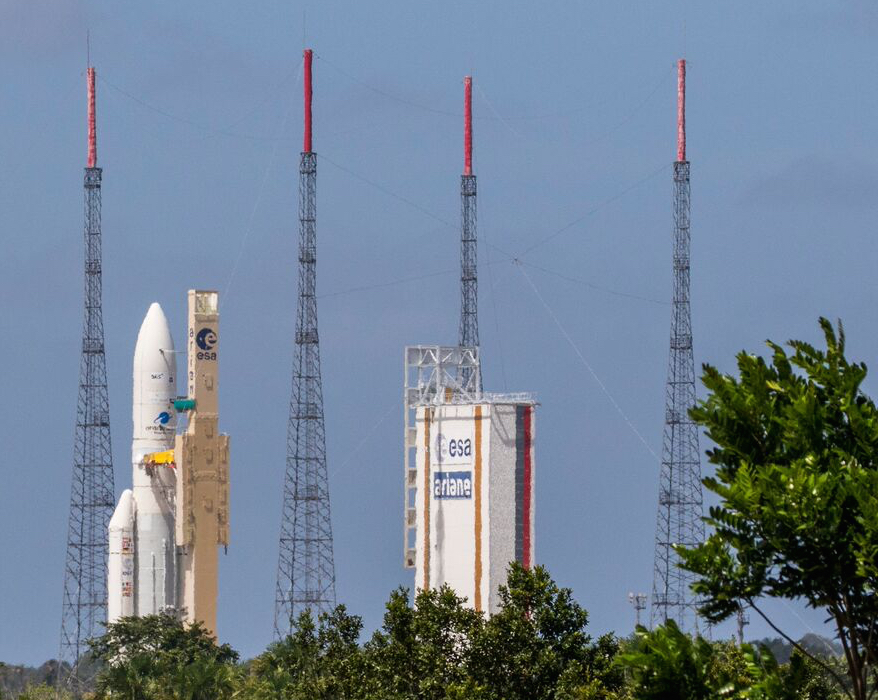 (Courtesy LASP/Rory Barrett) 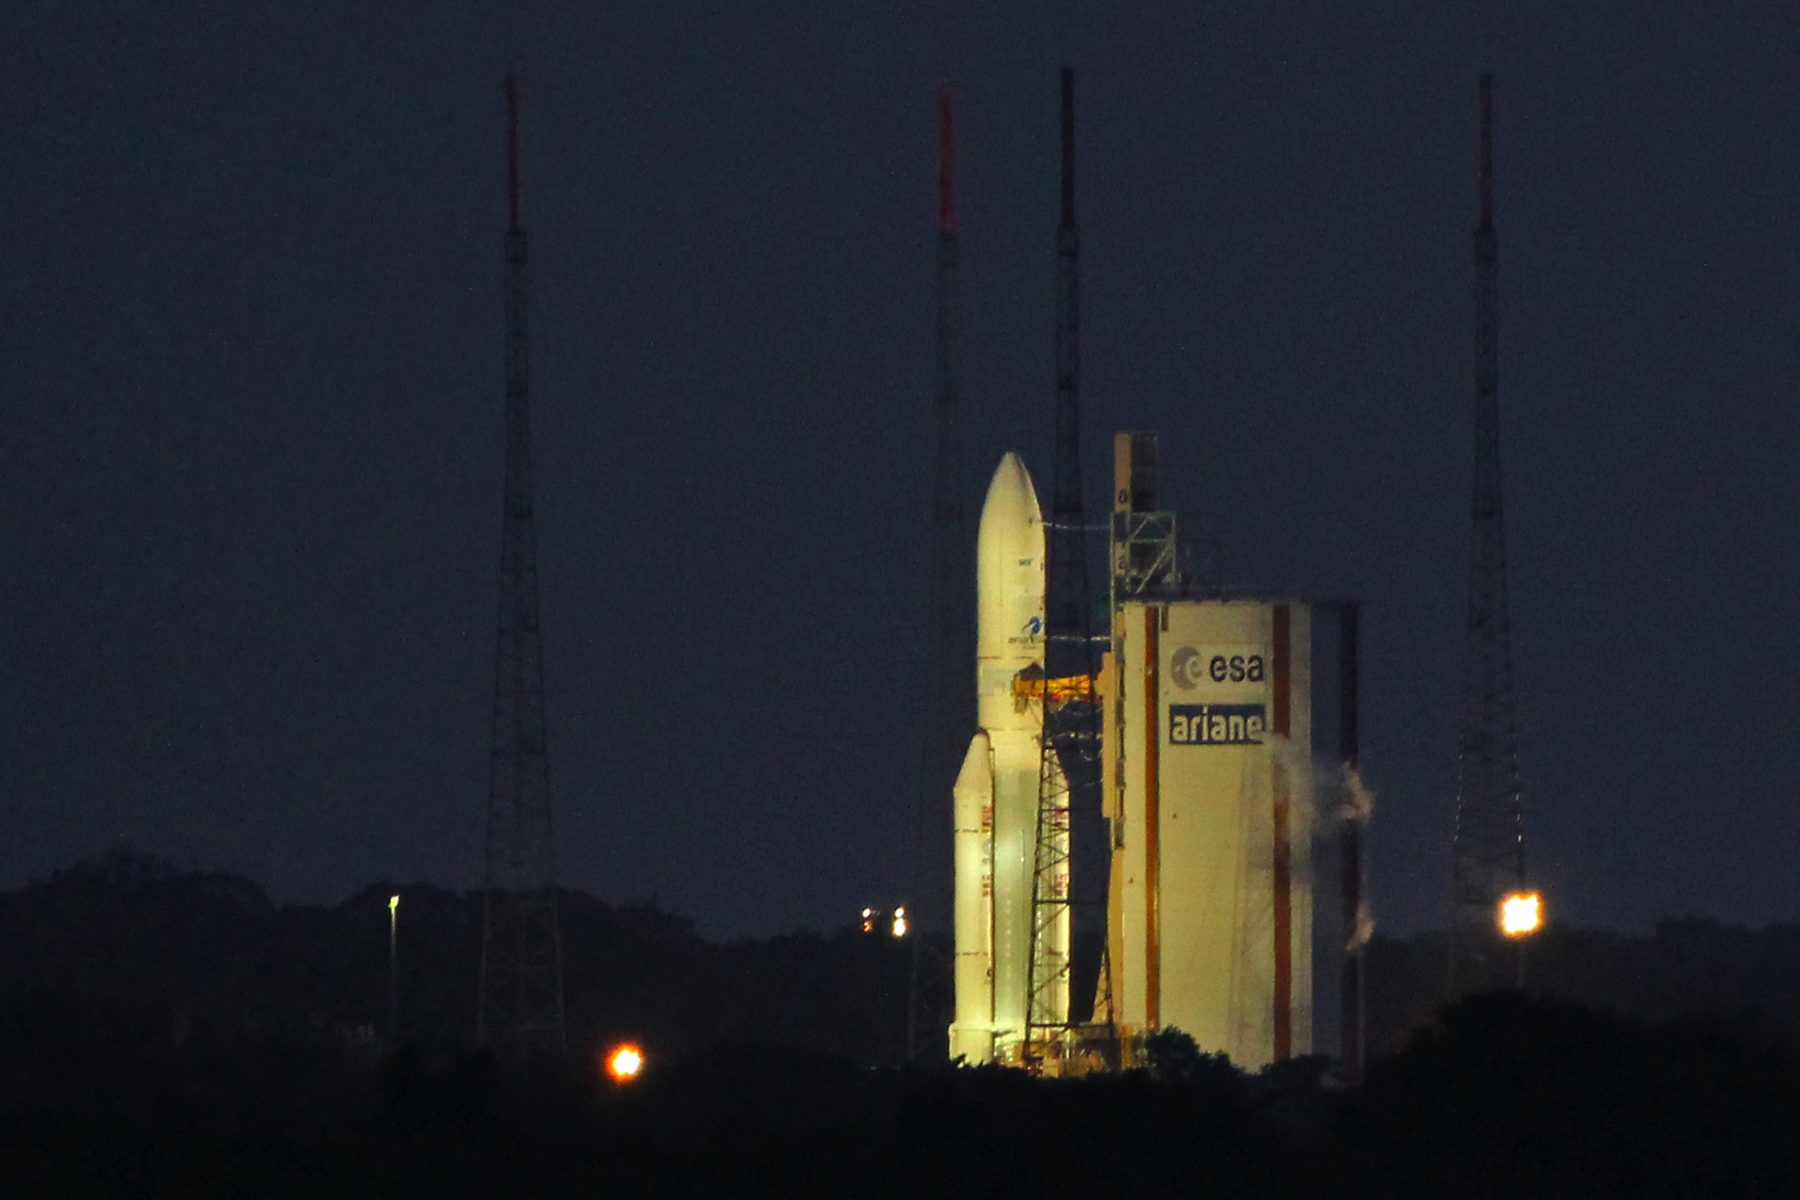 (Courtesy Stan Solomon) 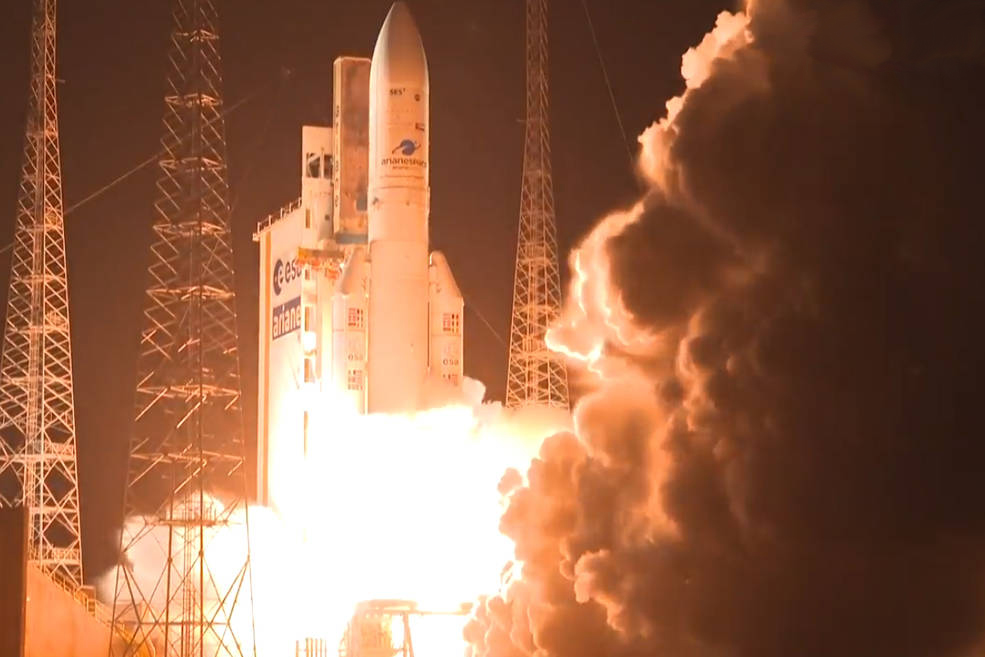 (Courtesy Arianespace)  (Courtesy Mark Lankton) 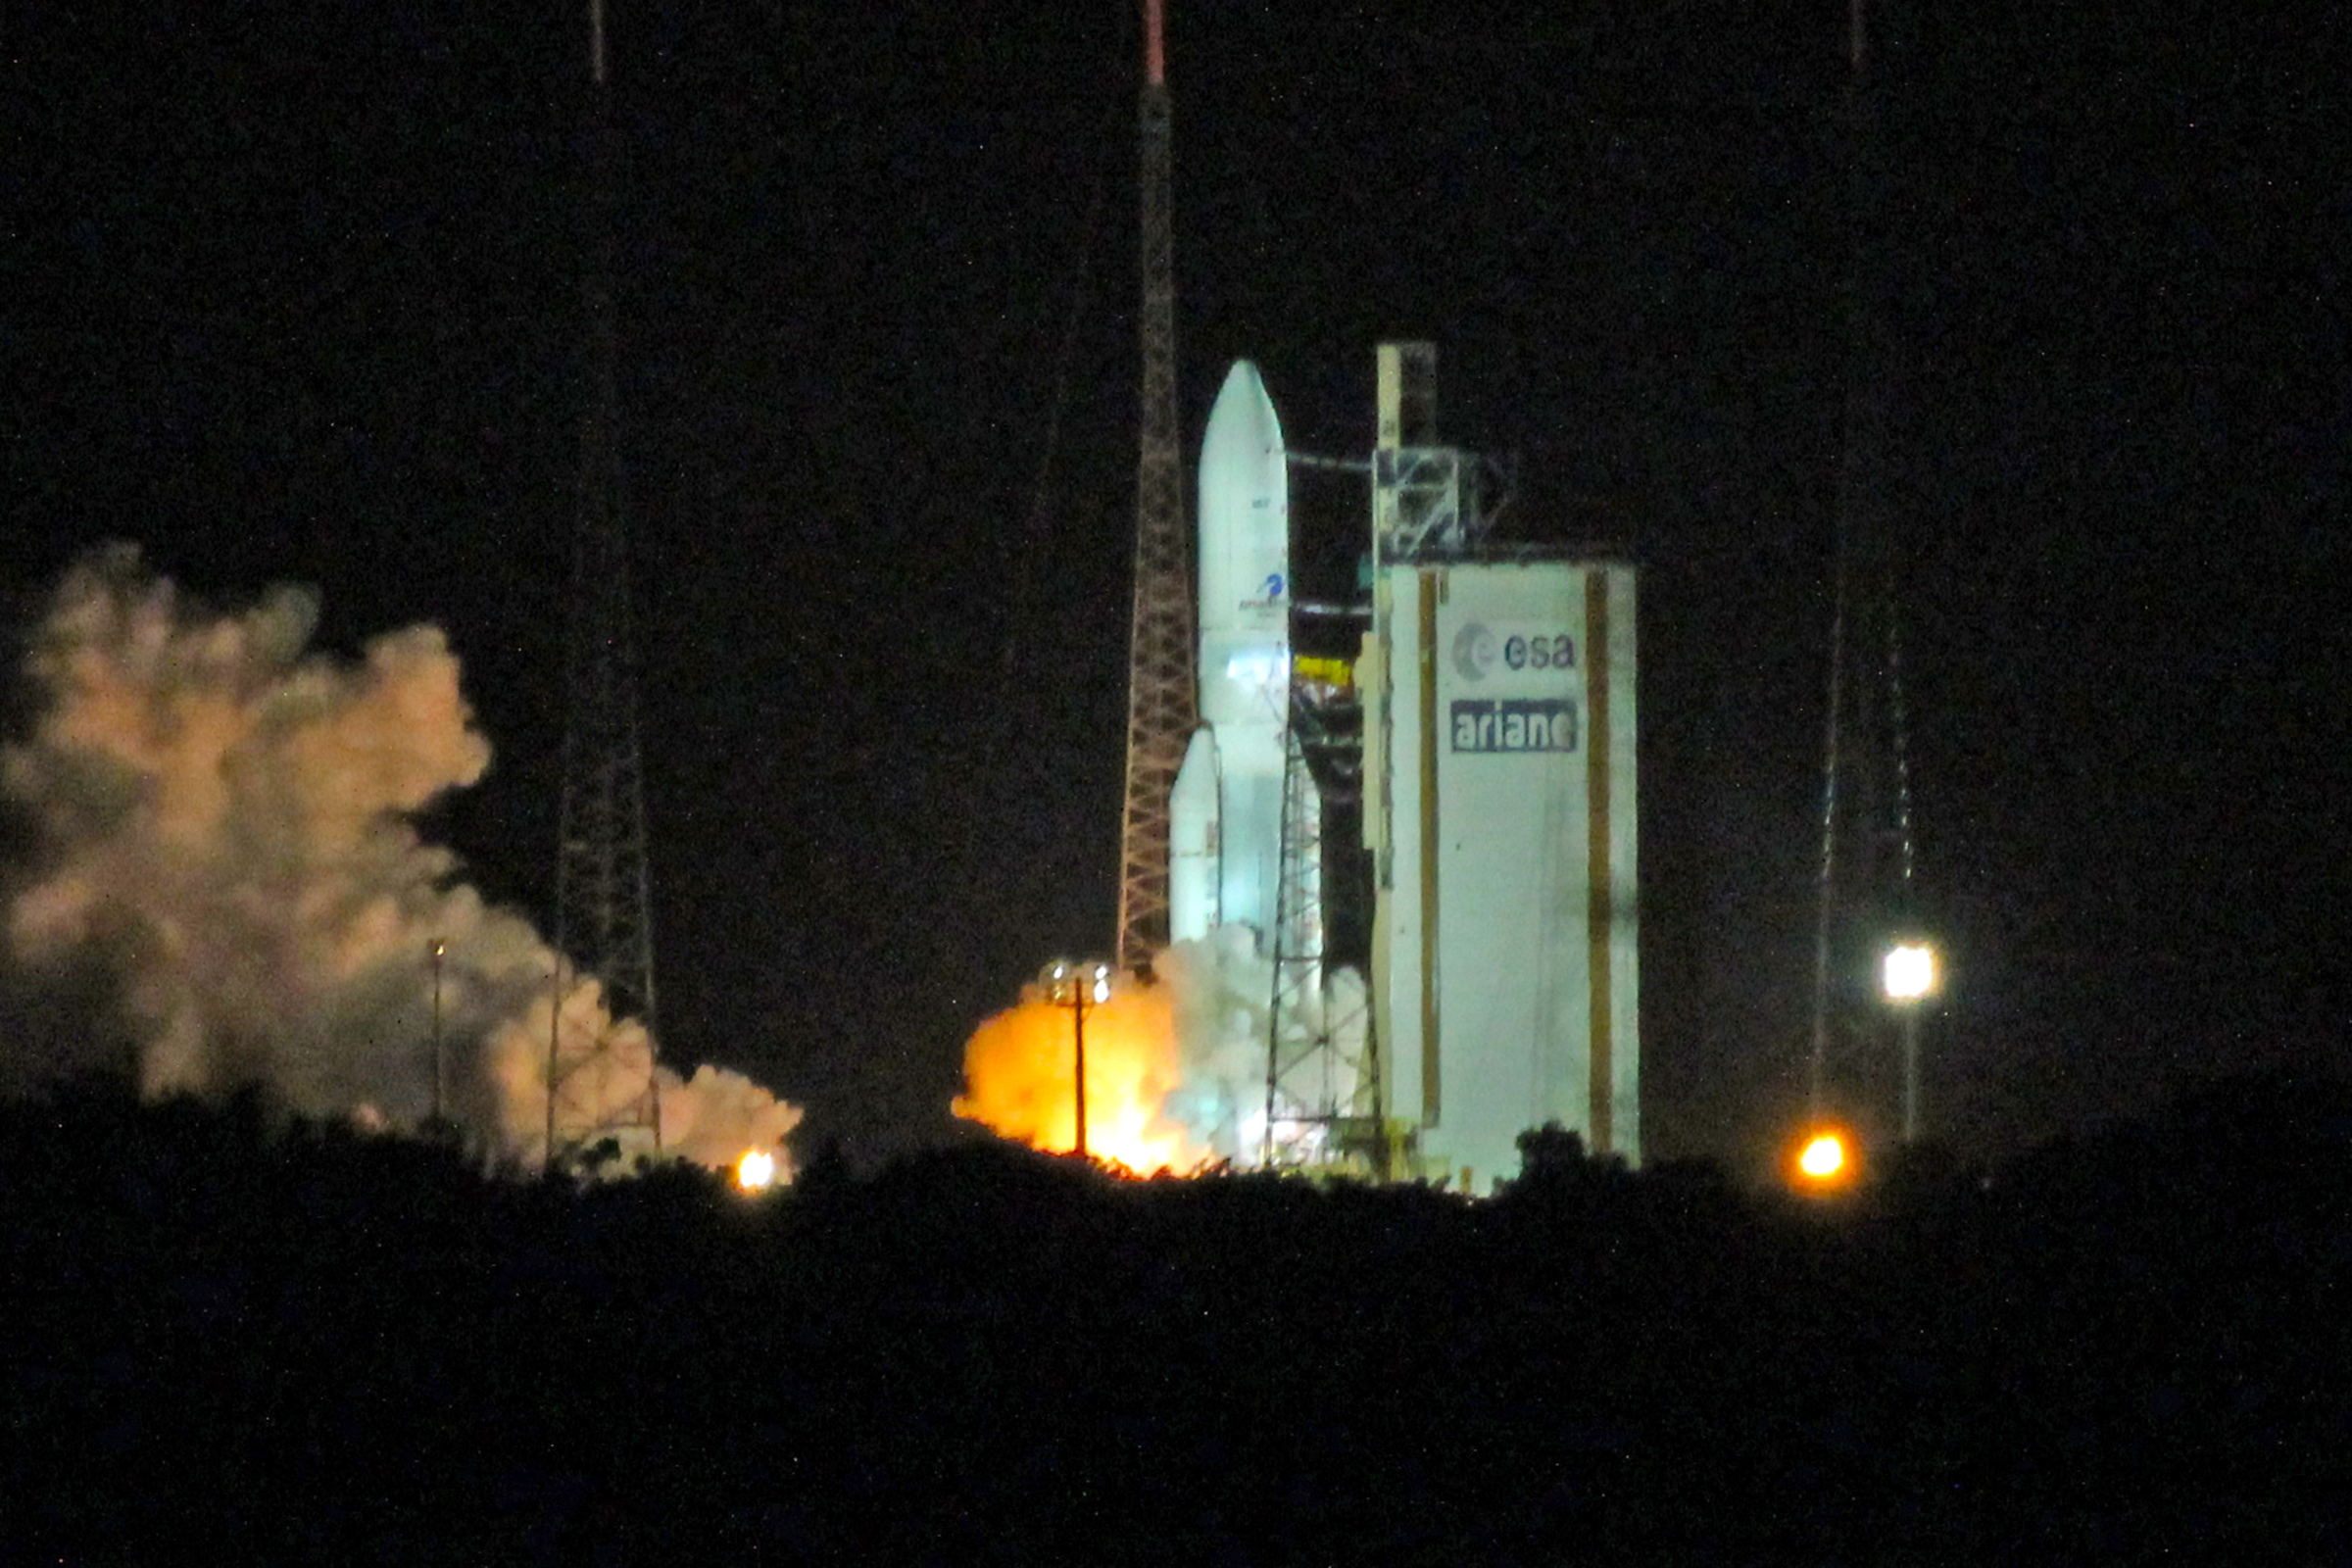 (Courtesy Stan Solomon)  (Courtesy Mark Lankton) |
Videos
Public talks
Richard Eastes – April 10, 2017
Katelynn Greer – May 1, 2019