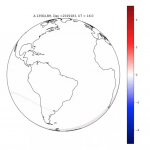
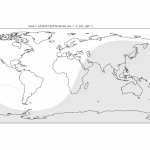
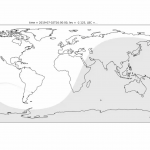
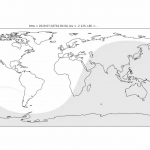
Table of special observation campaigns
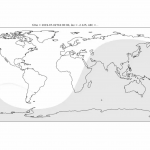
2023 Annular Solar Eclipse Campaign (Oct 13-15, 2023)
GOLD TDISK data from this special campaign was analyzed and is discussed in the paper “GOLD Observations of Thermospheric Neutral Temperature Variability During the 14 October 2023 Annular Solar Eclipse” by Aryal et al. The regular daily L2 TDISK data produced from Level 1C DAY data for these days are available through the GOLD download page. The TDISK data produced from Level 1C SP1 (special observation) data are available via the link below:
Eclipse_Campaign_October_2023_L2_SPTDSK.tar
2019 Waves Campaign (Oct 17-19, 2019)
GOLD L1B data from this special campaign was analyzed and is discussed in the paper “First comparison of travelling atmospheric disturbances observed in the middle thermosphere by GOLD to travelling ionospheric disturbances seen in ground-based total electron content observations” by England et al. This data is available for download via the link below:
Waves_Campaign_October_2019_L1B_data.tar (6 GB)
2019 Eclipse (July 2, 2019) – Simulations
Simulation steps:
- TGCM runs with (UV attenuation: eclipse condition) and without (non-eclipse condition) an eclipse mask from 16:00 UT on July 2, 2019 to 16:00 UT on July 3, 2019
- Ionospheric and thermospheric parameters from TGCM runs are used as inputs to the GLOW model
- GLOW model estimates of airglow are then mapped onto eclipse’s FOV and LOS effects are taken into consideration
- Finally, percentage difference between eclipse and non-eclipse results are shown in the movies
All files: Courtesy Saurav Aryal/GOLD
